
You do the research, create your Facebook ad campaign, wait for the results and…nothing happens. The impressions don’t come, the leads don’t materialize and the sales aren’t shooting sky-high. No matter how hard you try, this will happen to you eventually, and that’s why you need to be familiar with reporting: tracking, adjusting and learning from your campaigns.
You can use Facebook’s analytics to see how your ads are performing. One thing to look for is if your ads align with your social media goals for your business.
For example, if you are using Facebook ads to drive signups for your product, you might be curious to know which ad in your campaign is driving the most signups, how many people signed up through those ads, and how much each signup cost you.
Search and filter: Finding the relevant campaigns, ad sets, or ads
You can find any of your campaigns, ad sets, and ads by using the search bar at the top of Ads Manager. Type in search terms and choose from a list of predicted searches or choose a filter from the dropdown.
Narrow down your search by typing in:
- Campaign name
- Ad set name
- Ad name
- Campaign ID
- Ad set ID
Or filter by:
- Saved searches
- Name/ID
- Delivery
- Objectives
- Placement
- Campaign, ad set, or ad metrics
- Audience
- Attribution settings
- Recently changed
- A/B test
- Special ad category
- Test name
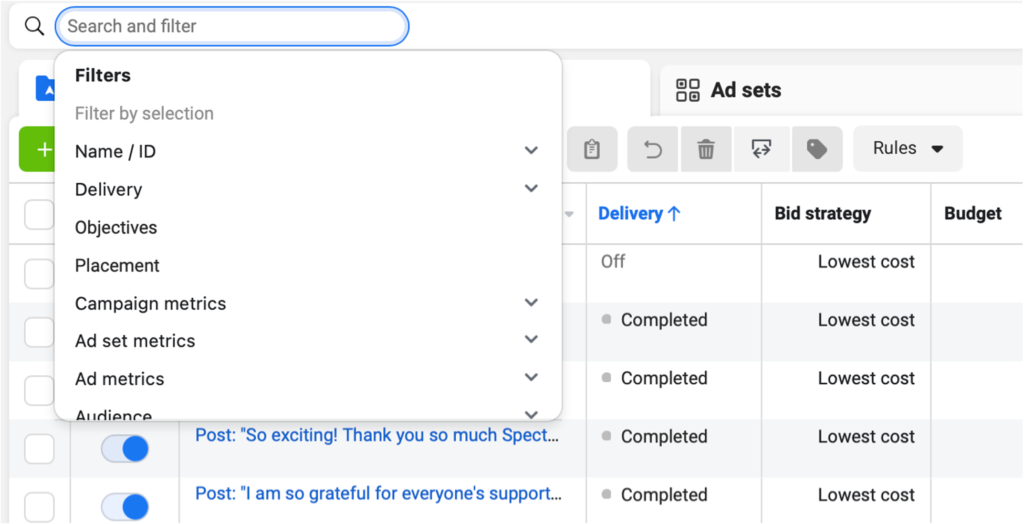
Select the arrow next to a filter category to see more detailed searches. Choose your filters and select Apply.
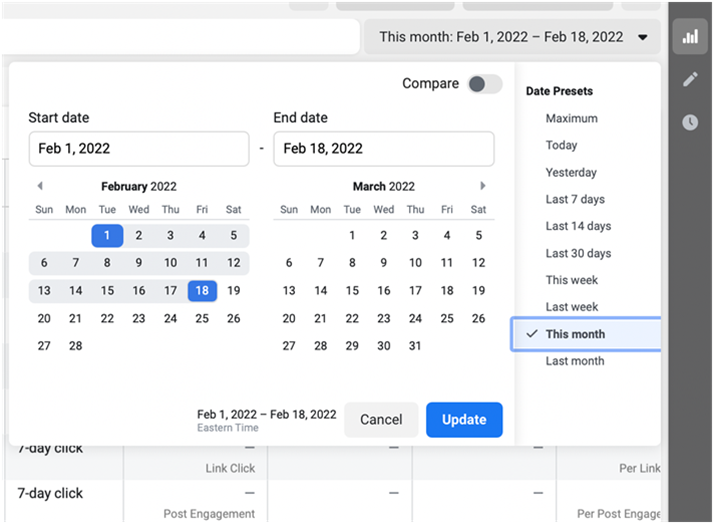
Additionally, you can specify the date range by clicking the dates next to the search and filter bar. Toggle the “Compare” feature to see how your ads are performing against a different date range.
This will give you the option to see your ads in the following date ranges:
- Maximum
- Today
- Yesterday
- Last 7 days
- Last 14 days
- Last 30 days
- This week
- Last week
- This month
- Last month
- Custom
Columns and breakdowns: Getting the important data for your ad reporting
Facebook provides you with a wealth of data for all your ads. Customize your reports by choosing which columns to display or by breaking down ad performance based on factors like audience and reach.
Choose columns to analyze ad performance
To help you find relevant data quickly, there are several presets of columns for you to explore.
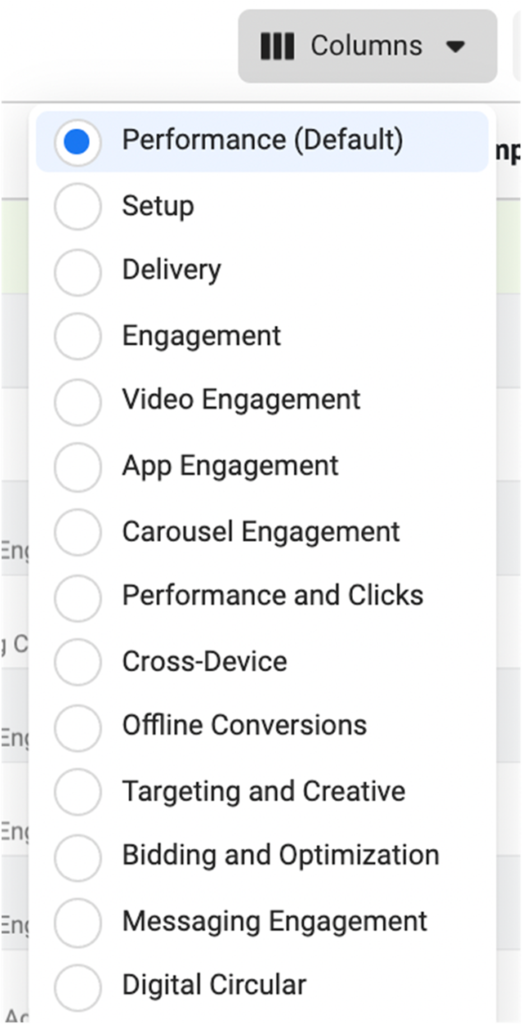
- Performance: Results, reach, amount spent, etc.
- Setup: Bid strategy, budget, objective, etc.
- Delivery: Reach, frequency, CPM, impressions, etc.
- Engagement: People taking action, reactions, comments, shares, etc.
- Video Engagement: Two-second continuous video plays, cost per two-second continuous video plays, thru plays, etc.
- App Engagement: Mobile app installs, mobile app actions, cost per mobile app install, etc.
- Carousel Engagement: Reach, frequency, impressions, clicks, etc.
- Performance and Clicks: Attribution setting, results, reach, cost, etc.
- Cross-Device: Website actions, mobile apps installed, conversion value, etc.
- Offline Conversions: Purchase, cost per purchase, etc.
- Targeting and Creative: Attribution setting, reach, frequency, etc.
- Bidding and Optimization: Results, cost per result, bid strategy, budget, etc.
- Messenger Engagement: Link clicks, messaging replies, blocked messaging connections, etc.
- Digital Circular: Instant experience outbound clicks, instant experience impressions, etc.
If none of these presets suits your needs, you can either customize the presets or create your own presets from scratch by choosing “Customize Columns…” in the dropdown.
![]()
A popup will appear, and you can deselect or select more metrics (or columns) according to your needs.
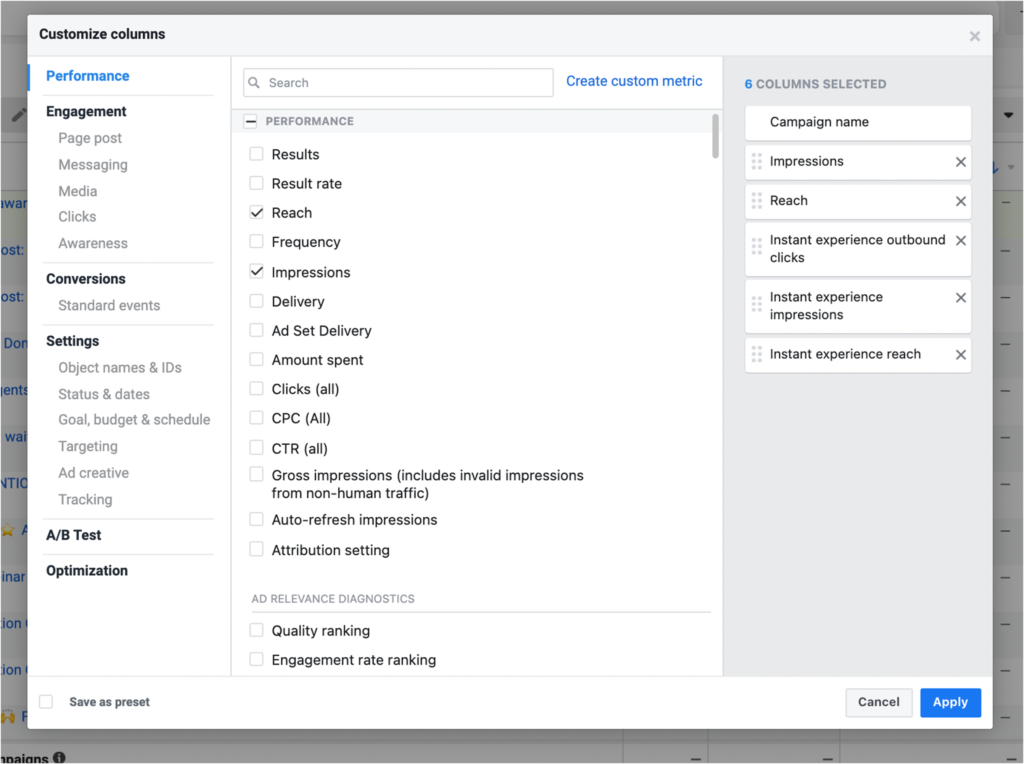
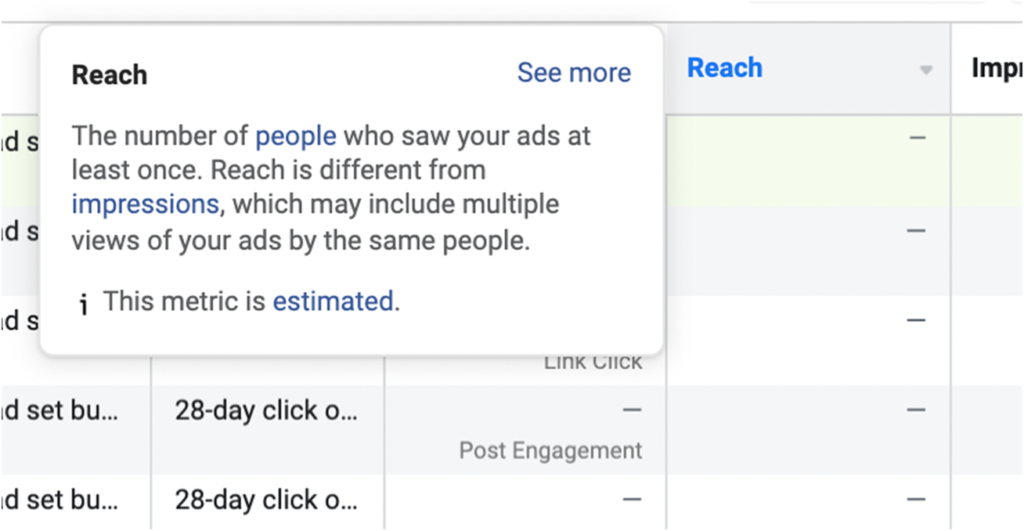
Each column can be sorted by clicking on the heading with the title. If you need clarification about each metric, hover over the name and a popup will give you more information.
Get greater detail with breakdowns
The breakdown feature allows you to get even more granular with your Facebook ads insights.
You can break down the data by:
- Delivery (e.g., age, location, or platform)
- Action (e.g., conversion device, destination, or video view type)
- Time (e.g., day, week, or month)
You’re able to select up to one criterion from each section (e.g., one from Delivery, one from Action, and one from Time).
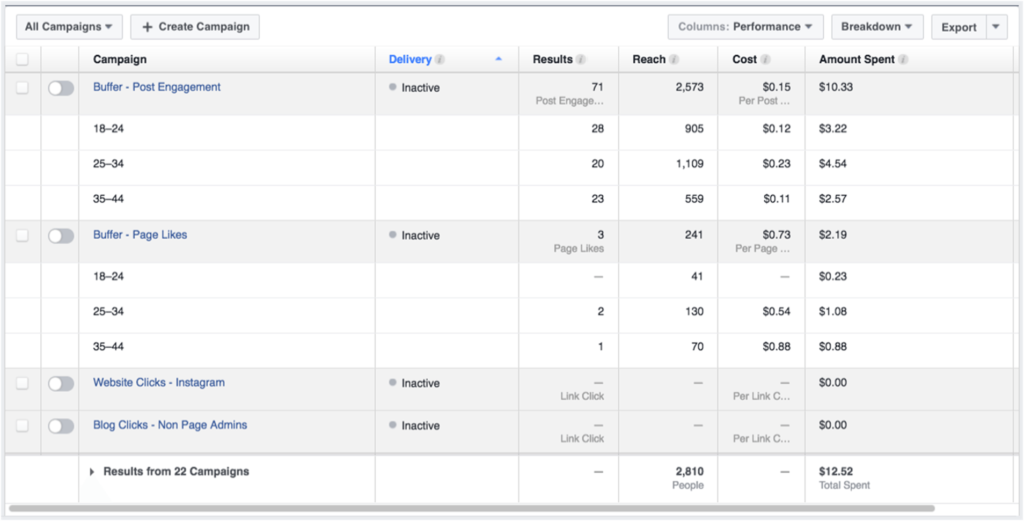
This is an example of how your reporting table might look after selecting the appropriate columns and breakdown:
Exporting, sharing, and saving Facebook ads reports
Once you’re satisfied with the data on your report, you can:
- Export: You can download the data as an Excel or CSV file.
- Create Custom Report: Further customize your report before downloading.
- Share: This option gives you a link to the view of data you created, which you can share with people who have access to your ad account.
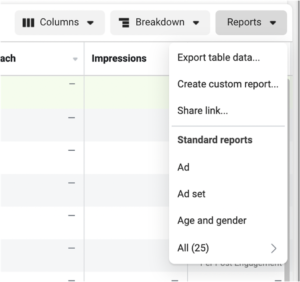
If you’re not sure which option to choose, Facebook also provides some standard reports to choose from.
Understanding the performance of your Facebook ads
Analyzing your ad performance will help you create more effective ads in the future. Facebook Ads Manager allows you to drill down in each of your campaigns, ad sets, or ads, providing more detailed information, such as results over time and demographics breakdown.
Remember the other menu we mentioned on the right-hand side of Facebook Ads Manager? This is where that menu comes into play.
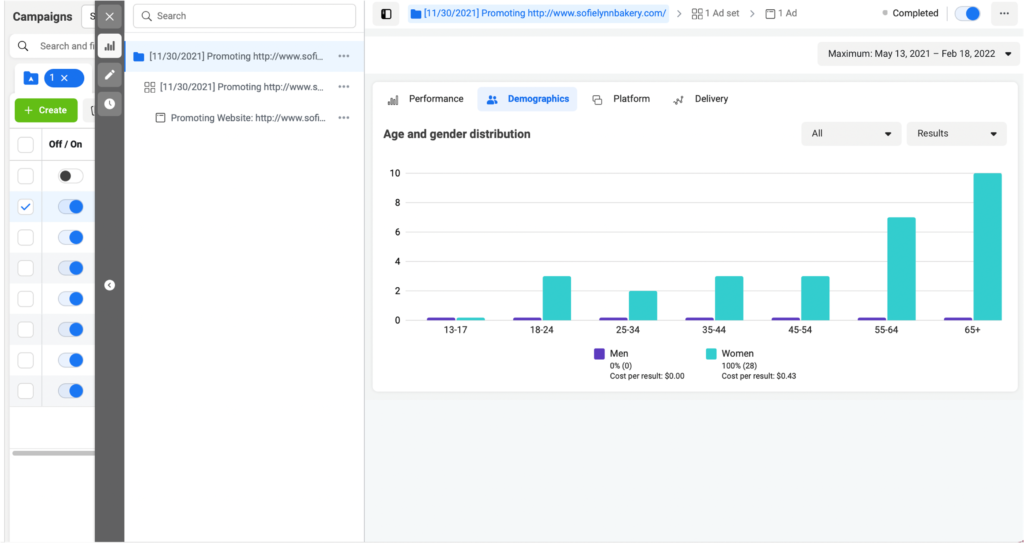
Choose the campaigns, ad sets, or ads you wish to see analytics on, and then hit “View Charts” on that right-side menu. This opens a visual representation of your ad’s performance.
In this expanded view, you will see various metrics for your campaign.
- Performance: This chart shows link clicks, people reached, and the amount spent. If you scroll over the line chart, you’ll see individual results for that day reflected in the chart. Click “Custom” to isolate certain metrics.
- Demographics: This chart shows how your ad performed across different ages and genders. Scroll over each section to see individual results for each age group. You can filter results at the top.
- Platform: This tab shows you how your ad performed across different platforms (e.g., Facebook or Instagram) and placements (e.g., Facebook desktop right column or Instagram mobile News Feed). You can view data like ad results, impressions, reach, and amount spent across platforms. You can also compare data on mobile vs. desktop.
- Delivery: Here, you will see the predicted and delivered value for reach, impressions, and amount spent.
Quickfire overview of other useful features
Outside of the Facebook Ads Manager, you’ll find some additional tools. They are accessible via the menu button in the upper-left corner of your Facebook Ads Manager.
Audience Insights
Audience Insights helps you learn more about your audience with aggregated information about their demographics, location, behavior, and more.
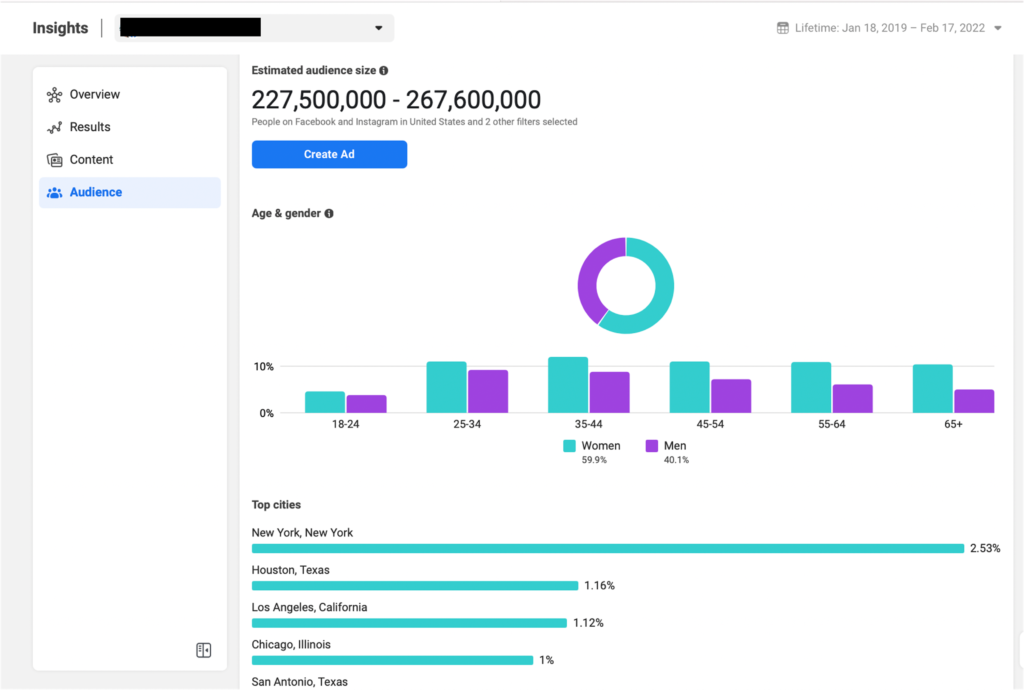
If you are keen to reach this audience, you can hit the blue “Create Ad” button to create an ad targeting this audience.
The Facebook Pixel
Facebook Pixel is a piece of code that enables you to leverage actions taken on your website to create better Facebook ads. By placing the Pixel code on your website, you can track conversions on your website, optimize your ads for conversions, and remarket to people who have visited your site or taken specific actions on your site.
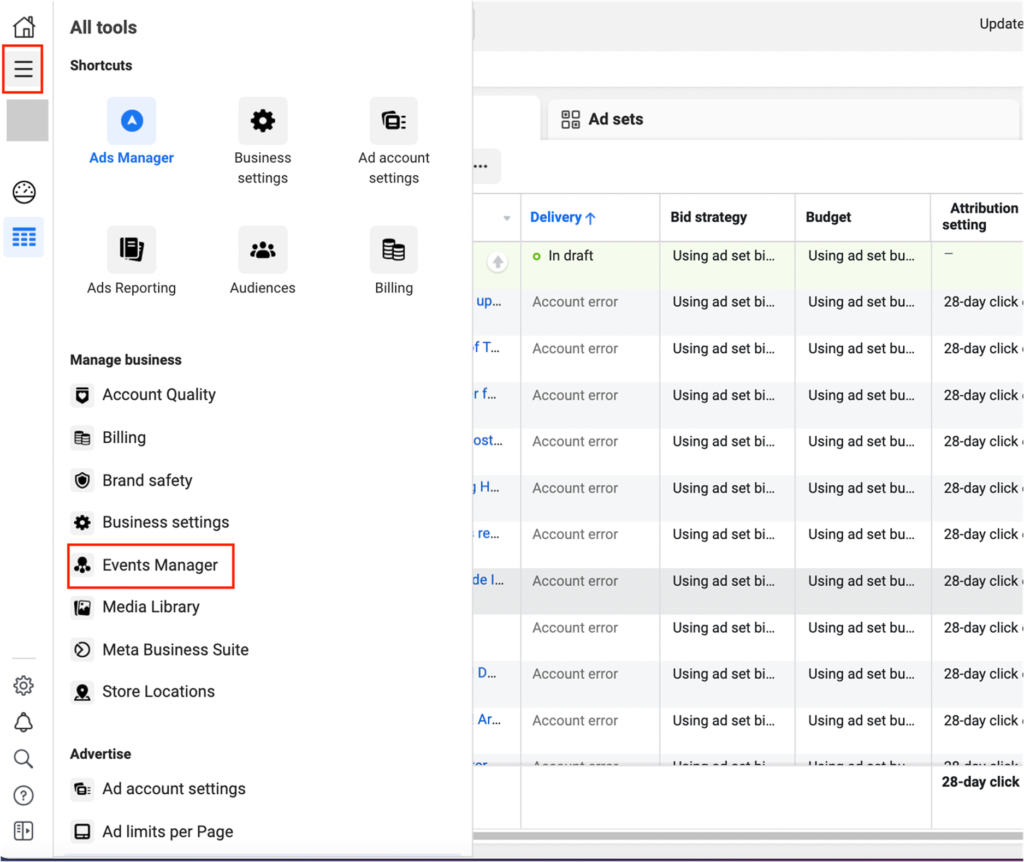
You can set up and track your Pixel by using Events Manager.
Relevant resources
There’s a lot to learn about Facebook Ads Manager, and we have just touched the surface of Facebook advertising. If you are interested in learning more and diving deeper into Facebook advertising, check out these useful tools and resources.
Facebook Ads Manager mobile apps
If you want to manage your Facebook Ads on the go, download the Facebook Ads Manager app for iOS and Android. With the app, you can create ads, manage your campaigns, get notifications about your ad performance, and check the metrics of your ads.
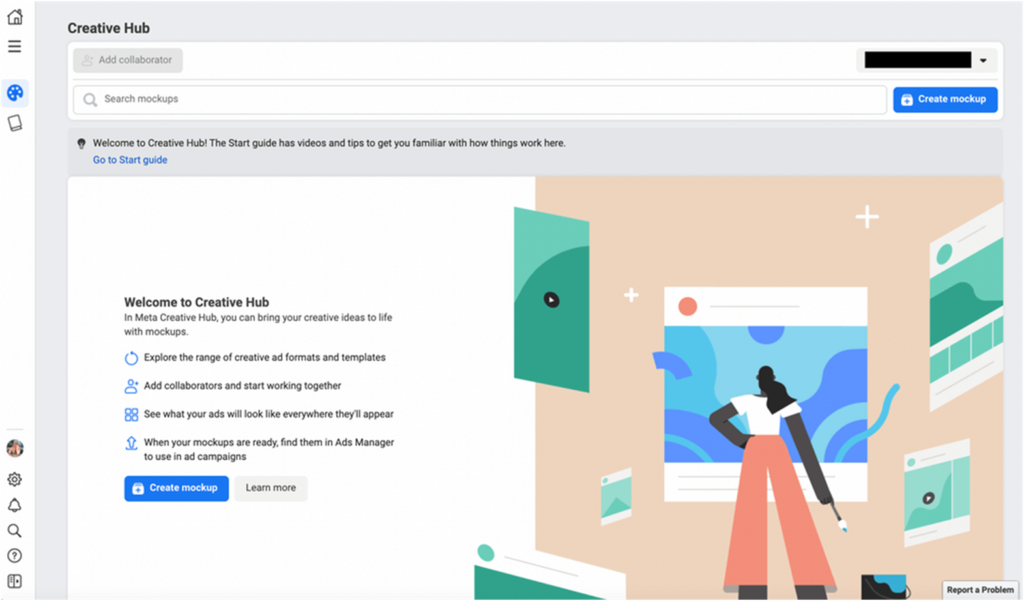
Facebook’s Creative Hub
Facebook’s Creative Hub is one of its latest tools for advertisers and marketers. This platform allows you to create mock-ups of ads, preview them as though they are live on a Facebook News Feed or Instagram Feed, and collaborate and share ideas with your team. Facebook has great resources if you want to learn more about the Creative Hub.
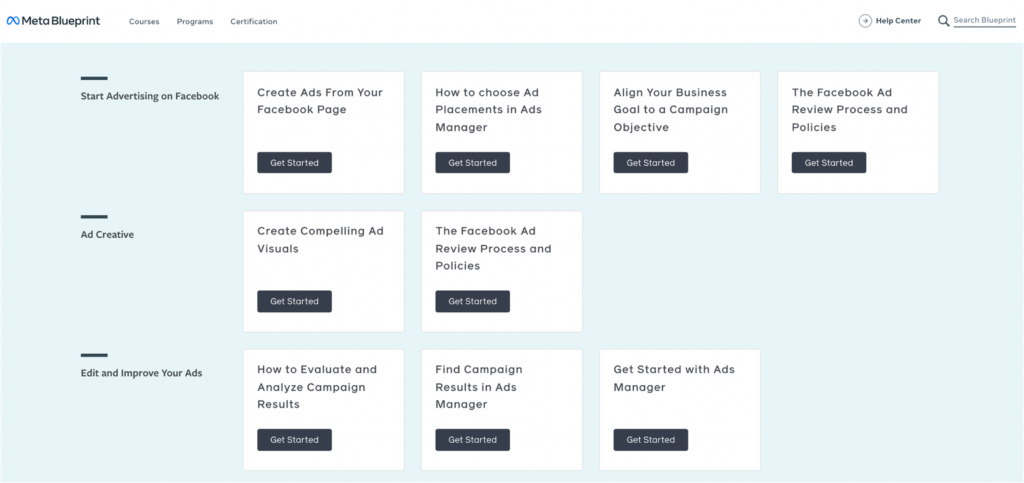
Meta’s Blueprint courses
Meta (Facebook’s parent company) has created many programs and resources for improving the quality of your Facebook ads. Its Blueprint courses cover everything, from writing your ad copy and creating videos for the mobile feed to getting the most out of the Facebook pixel.
Facebook ad specs and sizes
Getting the right specs and sizes for your ad visuals is important for your ad to perform. We know that these can change quite often, so here’s a link to the latest Facebook ad specs.
Things constantly change within the Facebook platform
Thanks for staying with us throughout this guide! With things moving so quickly at Facebook, there’s a chance some of this information might be outdated by the time you read it (hopefully not!). If you spot anything that needs updating since we published this post, let us know. We are keen to keep this guide up-to-date and useful for you.
PIN THIS BLOG POST ON YOUR PINTEREST IF YOU FOUND IT HELPFUL.
Ummmm … do you know how much I’d appreciate that?
I’d really appreciate it. Like a lot.
To pin on Pinterest, simply hover over the image below and click on the little “P!”
.
